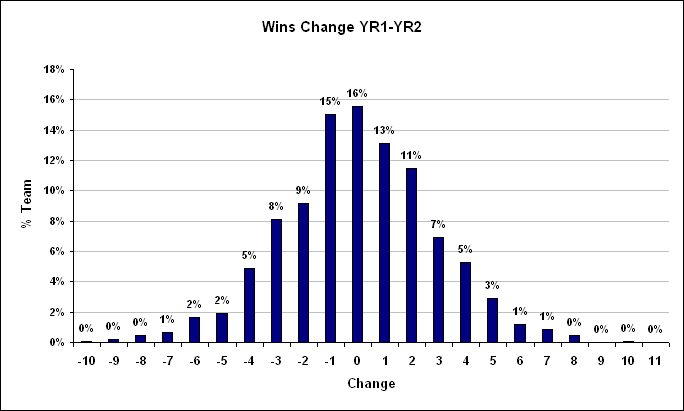
The table & chart above show the year to year wins change for VHSL teams for REGULAR SEASON GAMES and PLAYOFF GAMES.
You can see 1 team had a net wins change of -10, meaning they lost 10 games less in the next year.
16% of teams win the same number of games the next year. 44% of teams win the same number of games or win one more or less. |
Wins
Change |
Number
Teams |
% |
| -10 |
1 |
0% |
| -9 |
3 |
0% |
| -8 |
8 |
0% |
| -7 |
11 |
1% |
| -6 |
28 |
2% |
| -5 |
33 |
2% |
| -4 |
83 |
5% |
| -3 |
138 |
8% |
| -2 |
155 |
9% |
| -1 |
255 |
15% |
| 0 |
264 |
16% |
| +1 |
223 |
13% |
| +2 |
195 |
11% |
| +3 |
118 |
7% |
| +4 |
89 |
5% |
| +5 |
49 |
3% |
| +6 |
20 |
1% |
| +7 |
15 |
1% |
| +8 |
8 |
0% |
| +9 |
0 |
0% |
| +10 |
1 |
0% |
| +11 |
0 |
0% |
|